Mit Hilfe von DOT und GraphViz kann man Graphen ziemlich gut und ansehnlich visualisieren. Für Perl gibt es das Modul Tk::GraphViz, welches erlaubt Graphen in einer Canvas darzustellen. Den Inhalt der Canvas kann man natürlich auch als Datei anspeichern. Leider hat das Modul in Version 1.01 einen Bug, wodurch es nur mittels Workaround brauchbar ist. Der Workaround ist auf CPAN im entsprechenden Bug-Report zu finden.
#!perl
use strict;
use warnings;
use GraphViz;
use Tk;
use Tk::GraphViz 1.01;
######################################################################
# Parse the coordinates for an edge from the 'pos' string
# cf. https://rt.cpan.org/Public/Bug/Display.html?id=79377
######################################################################
sub Tk::GraphViz::_parseEdgePos
{
my ($self, $pos) = @_;
# Note: Arrows can be at the start and end, i.e.
# pos = s,410,104 e,558,59 417,98 ...
# (See example graph 'graphs/directed/ldbxtried.dot')
# hash of start/end coords
# Example: e => [ 12, 3 ], s = [ 1, 3 ]
my %startEnd;
# Process all start/end points (could be none, 1, or 2)
#while ( $pos =~ s/^([se])\s*\,\s*(\d+)\s*\,\s*(\d+)\s+// ) {
while ( $pos =~ s/^([se])\s*\,\s*([\d.]+)\s*\,\s*([\d.]+)\s+// ) {
my ($where, $x, $y) = ($1, $2, $3);
$startEnd{$where} = [ $x, $y ];
}
my @loc = split(/ |,/, $pos);
my @coords = ();
while ( @loc >= 2 ) {
my ($x,$y) = splice(@loc,0,2);
push @coords, [$x,$y];
}
(\%startEnd, @coords);
}
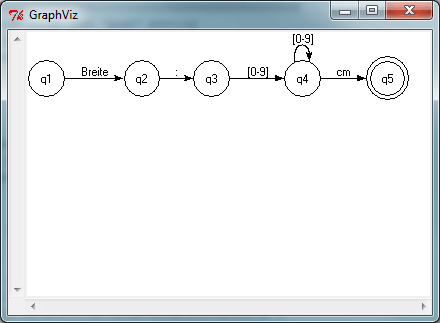
#my $dot_code = q~
#digraph 12.5 {
# graph [center rankdir="LR"]
#
# node [shape = doublecircle]; q5;
#
# node [shape = circle];
#
# q1 -> q2 [ label = "Breite" ];
# q2 -> q3 [ label = "\:" ];
# q3 -> q4 [ label = "[0-9]" ];
# q4 -> q4 [ label = "[0-9]" ];
# q4 -> q5 [ label = "cm" ];
#
# rankdir=LR;
#}
#~;
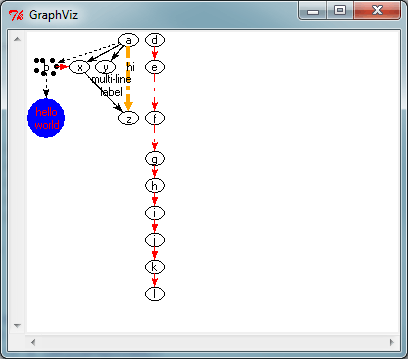
my $dot_code = q~
digraph test123 {
a -> b -> c [style=dotted];
a -> {x y};
b [shape=box,style="setlinewidth(5),dotted"];
c [label="hello\nworld",color=blue,fontsize=24,
fontname="Palatino-Italic",fontcolor=red,style=filled];
a -> z [label="hi", weight=100,
color=orange, style="setlinewidth(4),dashed"];
x -> z [label="multi-line\nlabel"];
edge [style=dashed,color=red];
b -> x;
{rank=same; b x}
d -> e -> f -> g -> h -> i -> j -> k -> l;
}
~;
my $mw = new MainWindow ();
my $gv = $mw->Scrolled(
'GraphViz',
-background => 'white',
-scrollbars => 'sw',
)->pack ( -expand => '1', -fill => 'both' );
$gv->createBindings ( -zoom => 1, );
$gv->bind ( 'node', '', sub {
my @tags = $gv->gettags('current');
push @tags, undef unless (@tags % 2) == 0;
my %tags = @tags;
printf( "Clicked node: '%s' => %s\n",
$tags{node}, $tags{label} );
} );
$mw->update;
$gv->show ( $dot_code );
MainLoop;
exit(0);